Excel - making a graph
Now, we need to draw a graph of height vs time-square, with time-square on the $x$ axis and the height on the $y$ axis.
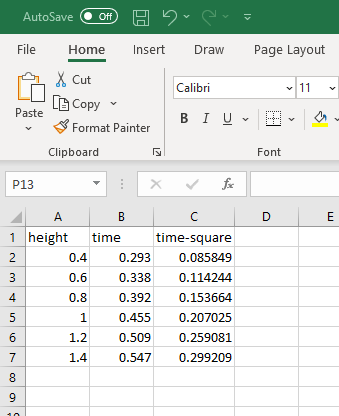
We have the $y$ values (height) column is before the $x$ values column (time-square). For the method that I will show you to make the graph requires the $x$ values column is before the $y$ values column.
So, I am going to copy the column A values and paste them into column D, so that we will have the $x$ column first then the $y$ column.
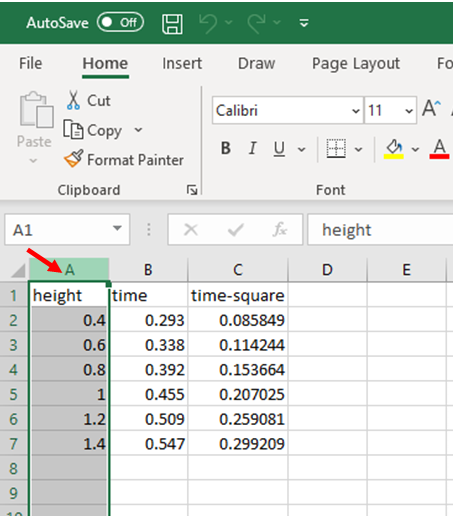
1: To copy the column A values, place the mouse on the letter A of column A and click the mouse to select that column.
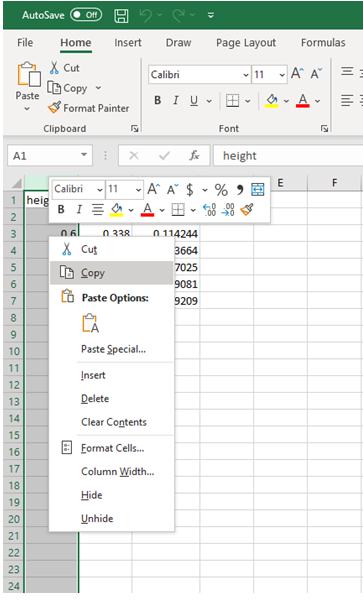
2: Now right click and select "copy".
You have copied the data from column A, now you need to paste them into column D.
3: Place the mouse pointer on letter D of column D and click to select that column. Next, right click the mouse.
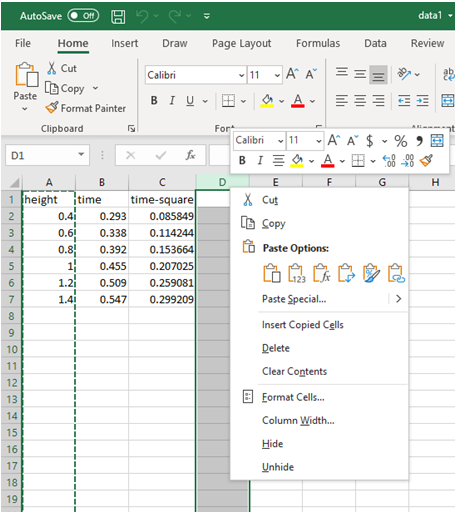
4: Under "Paste Options:", click on ![]() .
.
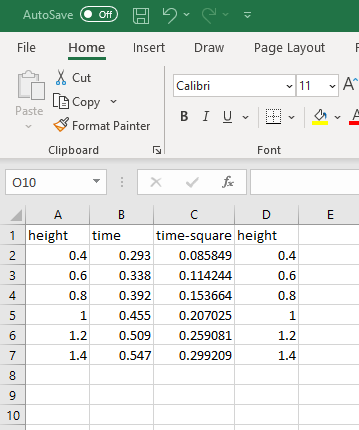
Now, we are ready to draw the graph.
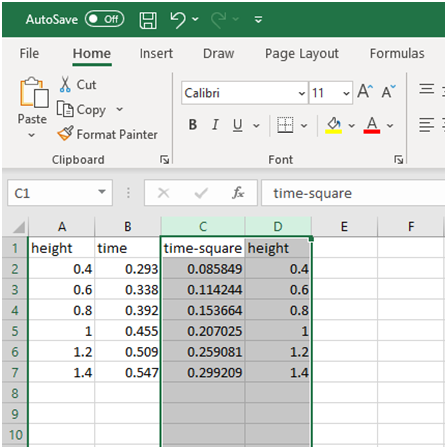
5: Select column C and D. To select column C and column D place the mouse pointer on C and click, then drag the mouse pointer to D while the mouse on the clicked state.
6: Move the mouse to the insert tab on the top,
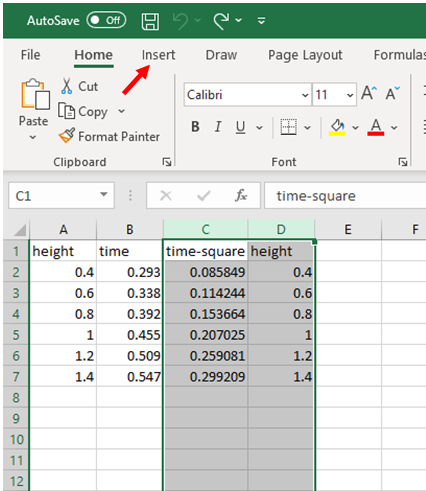
7: Click insert, once you click that you will see the following,
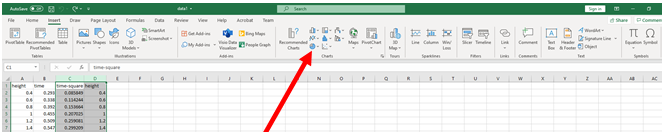
8: Go to the "Charts" group,
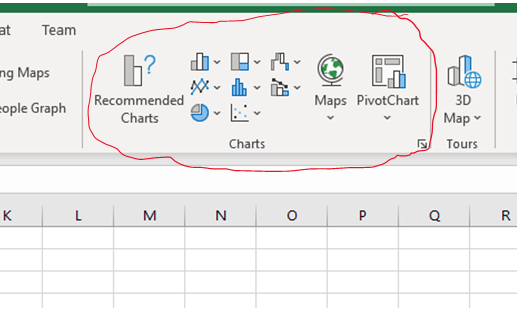
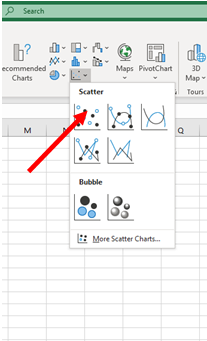
In the "Charts" group, there are several types of graphs to choose.
9: Pick the one pointed by the red arrow and place the mouse over that.
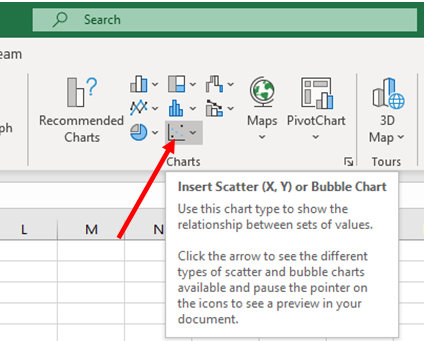
10:Click the mouse, and you will see the following,
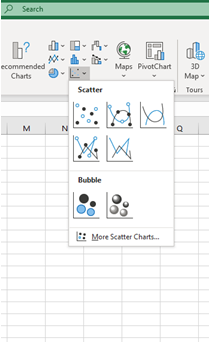
We are going to draw a scatter plot. So, select the first one.
11: Place the mouse over that and click once.
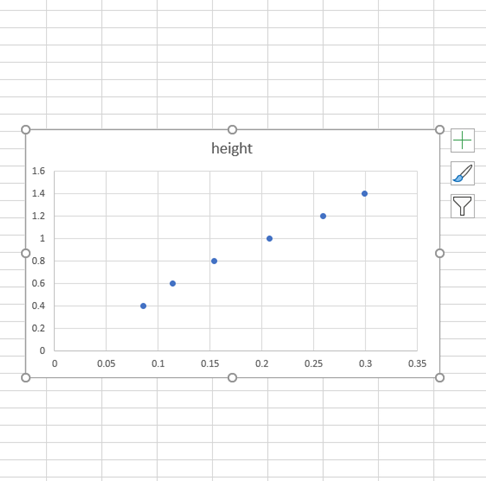
Once you click the mouse, you will see a graph appears as follows.
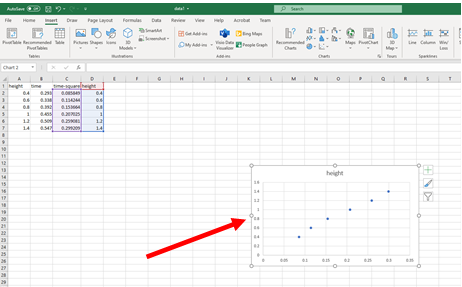
A close view of the graph is shown below.