Excel- adding a trend line
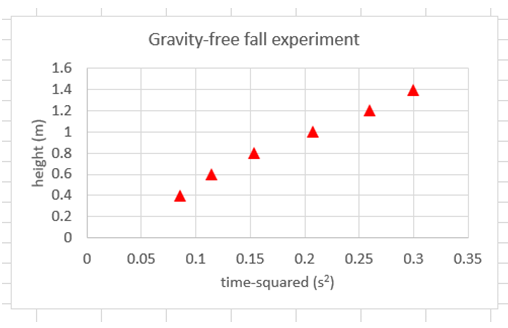
We have this graph and we are going to add a trend line.
1: Place the mouse pointer on the graph area and click once to see the plus sign.
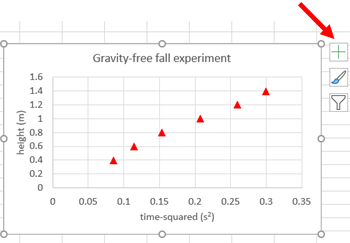
2: Click the + sign. And put the mouse over the arrow next to the "Trendline" (see the picture below) and click the mouse once.
You will see the following.
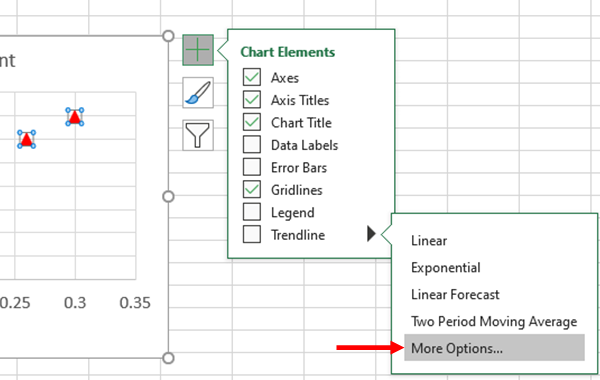
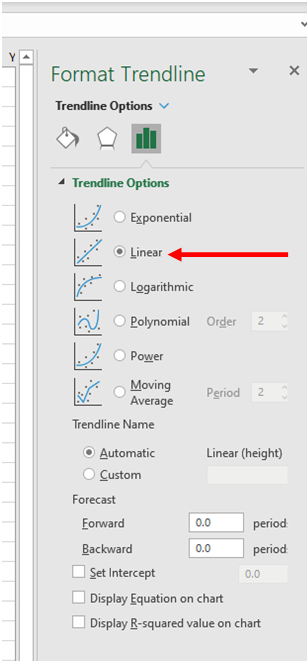
3: Move the mouse to "More Options..." and click once.
You will see the following on the right hand side, if not click the three green vertical bars.
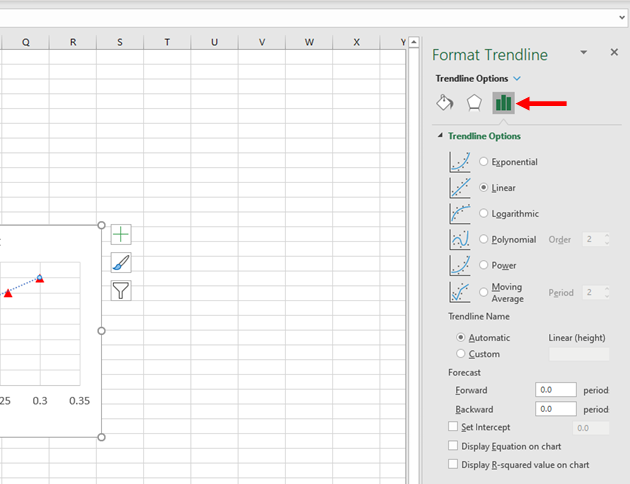
4: Now, select "Linear" if it is not selected as it is the default. Linear will give you a straight line as the trend line.
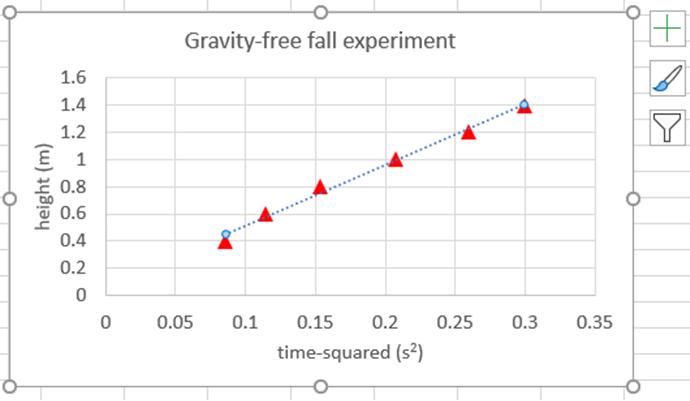
Now, if you look at the graph, you will see the dotted trend line.
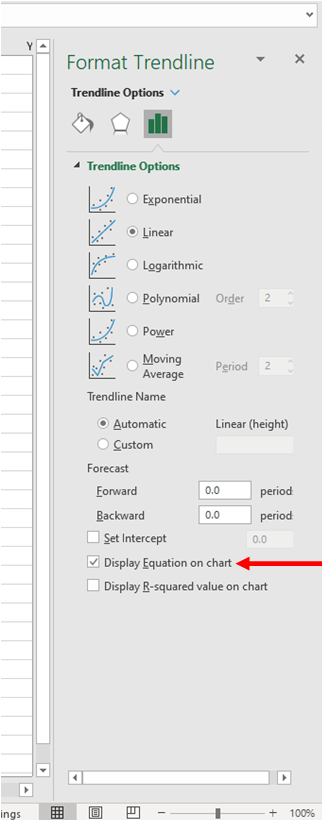
5: Click and select "Display Equation on chart".
Now, you will see an equation on the graph.
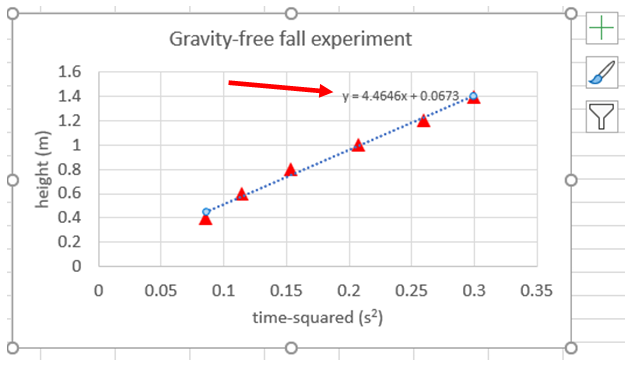
This is the equation on the graph: $y=4.4646x+0.0673$. Here the slope of the line is $4.4646$ and the $y$ intercept is $0.0673$. Some times you do not need the $y$ intercept, as in the free fall motion. So, we need to set the $y$ intercept equal to zero.
6: To set the y-intercept zero, click and select "Set Intercept". Also, make sure the value of the intercept is "0". If not change that into 0.
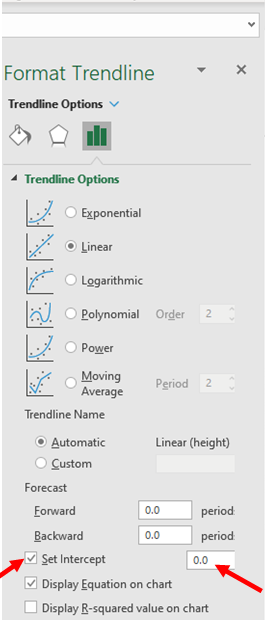
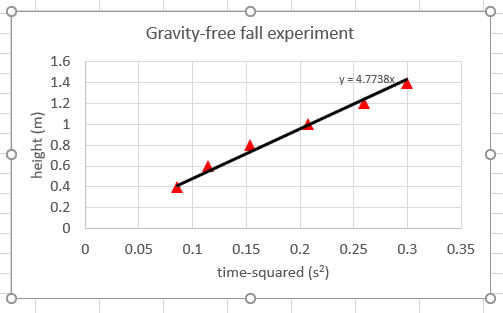
Now, you will see the equation on the graph with no $y$ intercept.
Also, you see that the slope changes. The slope now is $4.7738$.
The trend line now is a dotted line, you can change that into a solid line, and also you can change the color and the thickness of the line.
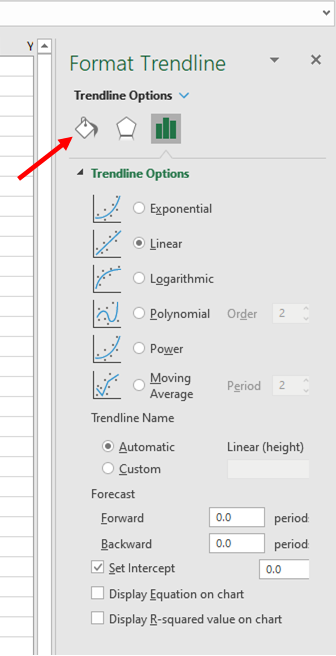
7: To do that move the mouse pointer to the icon pointed by the red arrow.
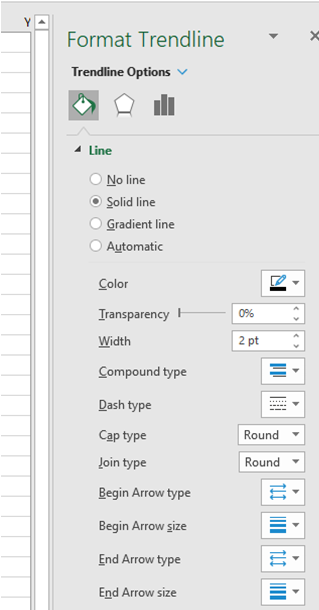
8: Click the mouse once, you will see the following,
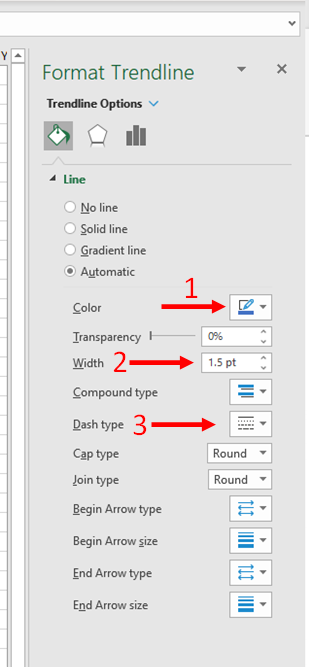
9: To change the color of the trend line, go to "Color" (1) and change there. To change the width of the line go to "Width" (2) and change it. To change the line type, dashed, dotted or solid, go to "Dash type" (3) and change it there.
I changed the line color to black, the line width to 2 pts and the line as a solid line.
Now the graph looks as follows,
If you want to move the equation little away from the line, you just place the mouse on the equation text, click+hold and drag the mouse to the desired place. To change the font size, select the text box and go to the home tab of the excel and change the size there.
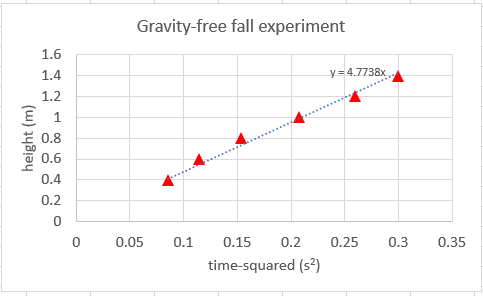
Now, we have the slope of the trend line, i.e.,
Slope$=4.7738$
So, we can find the acceleration due to gravity, $g$ with the equation:
$g=2\cdot$ slope
i.e., $g=2\cdot 4.7738=9.55$, after rounding to two decimal places.
Putting the unit,
$\boxed{g=9.55 m/s^2}$.
But the accepted value of $g$ is $9.80 m/s^2$. With this value we can estimate the percentage error in our measurement.
% error $=\bigg\lvert \dfrac{9.55-9.80}{9.80} \bigg\rvert \cdot 100=2.6 \%$.